OceanLook Ship Report – Analyze Vessel Operations at a Glance
Hello!
This is OceanLook — the eyes on the world’s oceans.
Analyze Vessel Operations at a Glance
A Smarter Vessel Report with OceanLook Ship Report
In the maritime and logistics industry, the days of simply checking a vessel’s current location are over.
Today, it is essential to analyze not only where a vessel is, but also where it has been, how far it has traveled, and how long it stayed at each port.
OceanLook Ship Report goes beyond simple AIS tracking.
It is an advanced analytics feature that provides a comprehensive report of a vessel’s voyage history, speed patterns, port stay durations, and route behavior — all in one place.
What is Ship Report?
If you want, I can also help refine it into a more global SaaS-style introduction (the tone commonly used by companies like MarineTraffic, Kpler, and Windward), which works even better for international readers.

Ship Report is one of OceanLook’s core features that automatically analyzes a vessel’s operational data for a selected time period and presents it in an intuitive report format on a single screen.
Key capabilities include:
- Select a specific vessel and time period
- Automatic aggregation of voyage history
- Analysis of port and berth stay durations
- Visualization of speed patterns and sailing routes
- Data export functionality available
👉 The report can be immediately used for operational analysis, internal reporting, or client presentations.
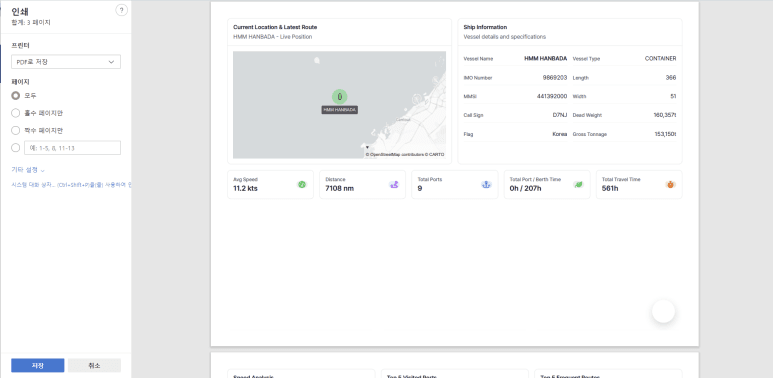
1️⃣ Real-Time Location & Latest Route Tracking
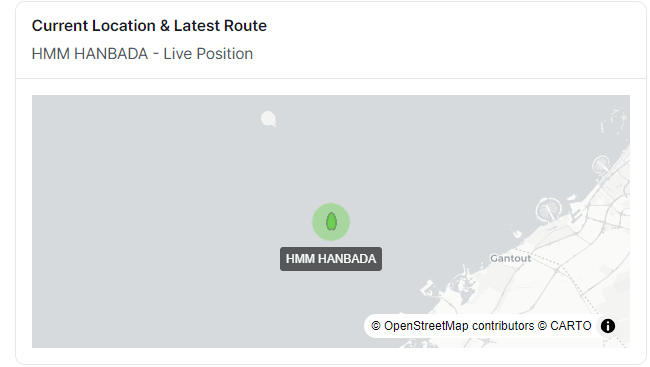
Current Location Check
When you click the most recent AIS track, it is instantly displayed on the map.
At the top of the Ship Report, users can view the vessel’s current location and latest sailing route on a map-based interface.
Key features include:
High-resolution maps powered by OpenStreetMap
Visualization of the vessel’s recent movement path
Instant understanding of the vessel’s current voyage status
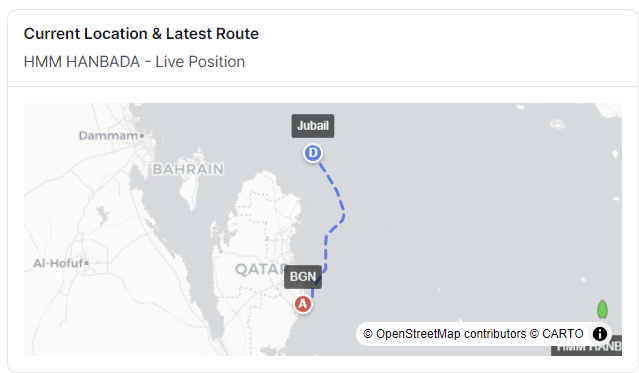
This allows users to go beyond simply asking:
“Where is the vessel now?”
to clearly understanding:
“What route did the vessel take and how did it get there?” — all at a glance.
2️⃣ Automatic Organization of Vessel Basic Information
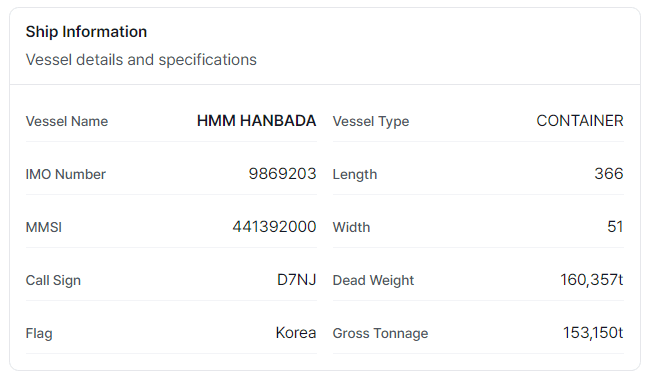
Vessel information that was previously scattered across different sources — such as IMO, MMSI, and Call Sign — is automatically organized in one place.
The report provides key vessel details including:
- Vessel Name / IMO / MMSI
- Vessel Type (e.g., Container, Bulk Carrier, etc.)
- Dimensions and Capacity (Length, Beam, DWT, GT)
- Average Sailing Speed
- Total Distance Traveled & Total Sailing Time
👉 The key advantage is that vessel specifications and actual operational data can be viewed together in one report.
3️⃣ Operational Summary at a Glance

Ship Report summarizes vessel operations within the selected period using key numerical indicators.
- Total Distance Traveled (nm)
- Total Sailing Time (h)
- Number of Ports Visited
- Total Port Time / Berth Time
- Average Speed (kts)
📌 These metrics allow users to quickly evaluate operational efficiency, port stay ratios, and schedule stability.
4️⃣ Speed Pattern Analysis, Top 5 Port Analysis, and Top 5 Major Route Analysis
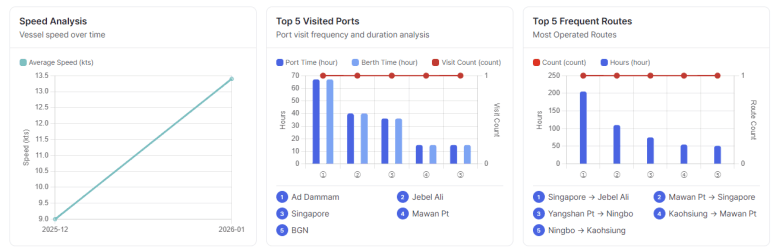
Ship Report analyzes vessel speed over time, allowing users to visually identify:
- Average speed
- Speed variations across voyage segments
- Low-speed zones
This helps users easily understand operational patterns through clear visualizations.
👉 Particularly useful for analyzing slow steaming, waiting time, and congestion areas.
It can also support analysis related to CII (Carbon Intensity Indicator), fuel efficiency, and voyage optimization.
Ship Report also summarizes the most frequently visited ports, including:
- Number of visits
- Port Time
- Berth Time
📍 Identify which ports have the longest stay durations
📍 Understand the vessel’s key operational ports
These insights are valuable indicators for shipping companies, terminal operators, and freight forwarders.
Ship Report automatically analyzes the most frequently sailed routes of the vessel.
The report includes:
- Origin → Destination
- Number of voyages
- Average travel time
👉 This helps users identify regular service routes,
👉 and analyze route stability and operational strategy.
7️⃣ Detailed Voyage-Level Operational Data (Core Feature)
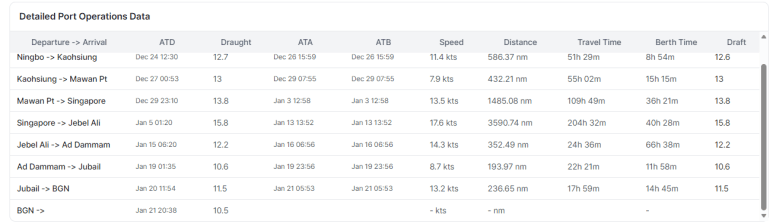
This is one of the most frequently used features in practical operations.
For each voyage, Ship Report provides the following information in a structured table format:
- ATD / ATA / ATB
- Average Speed
- Distance Traveled
- Sailing Time
- Berth Time
- Draft Changes
✔ No need to manually organize data in Excel
✔ A complete voyage operation report can be generated directly from Ship Report
8️⃣ Export Function – Ready for Reporting
Ship Report data can be easily utilized through the Export function for:
- Internal reports
- Client presentation materials
- Operational analysis
This is not just a screen for viewing data,
but a data report designed for real business use.
What Makes OceanLook Ship Report Different
✅ Focused on operational analysis, not just vessel location tracking
✅ Automatic reports generated based on selected time periods
✅ Detailed analysis including port and berth stay durations
✅ User-friendly UI and data structure designed for operational users
✅ Suitable for government agencies, shipping companies, and terminal operators
Recommended For
- Shipping company operation managers
- Port and terminal operation managers
- Maritime data analysts
- Logistics and SCM planners
- Ocean data–based service developers
Conclusion
OceanLook Ship Report goes beyond simply recording vessel movements.
It provides an analytical report that supports better decision-making.
When a single vessel’s monthly operations can be organized into clear and structured data,
strategies in shipping, port operations, and logistics can become significantly smarter.