Introducing OceanLook’s 4 Value-Added APIs
Hello from OceanLook, the eyes on the global ocean.
Data-Driven Decision Solutions for Shipping, Logistics, and Public Sectors
As global supply chains become more complex, real-time vessel position data (AIS) alone is no longer enough.
What matters is not only “Where is the vessel now?” but also:
When will it arrive? How long will it be delayed? What is its next movement?
To meet these market demands, OceanLook provides four powerful value-added APIs that go beyond simple vessel tracking.
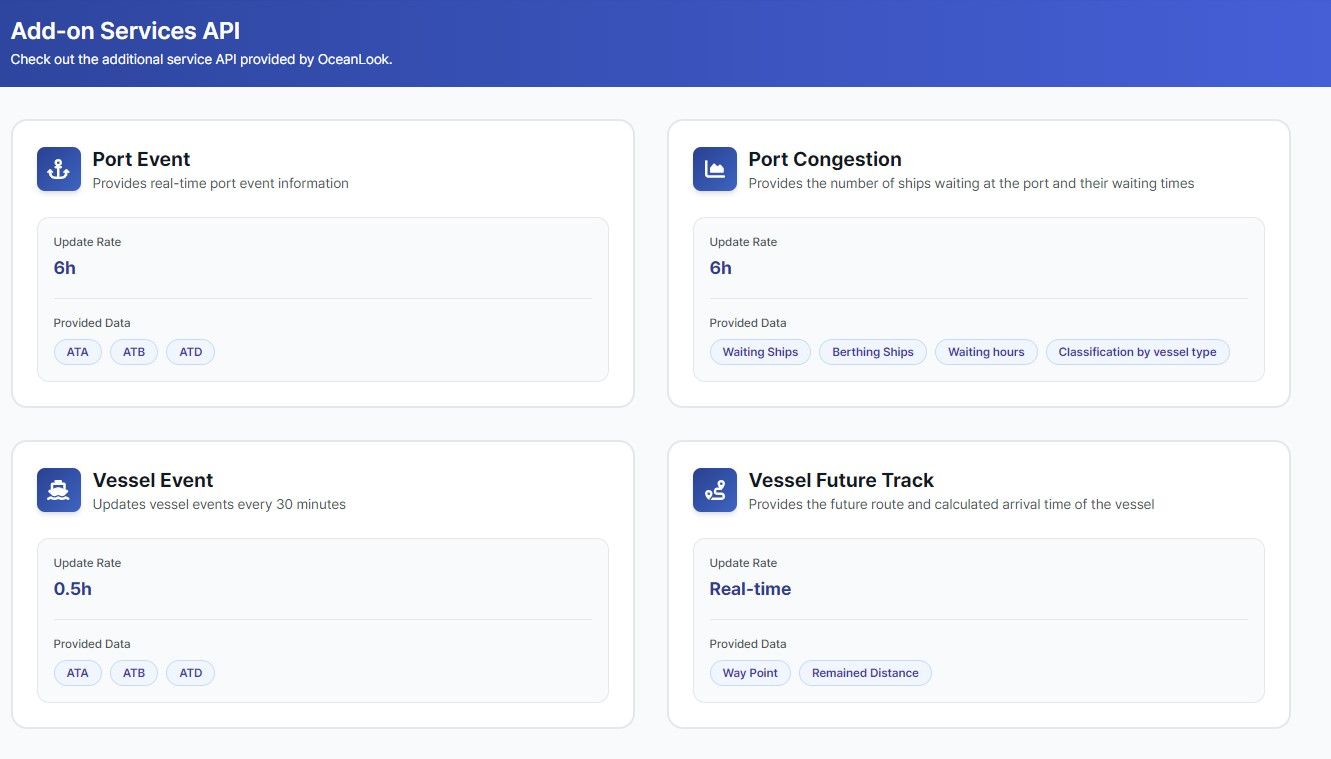
- Port Event API
- Port Congestion API
- Vessel Event API
- Vessel Future Track API
In this article, we introduce what each API provides and how shipping companies, cargo owners, logistics firms, public agencies, and research organizations can use them.
1. Port Event API
Precision Voyage Analysis with Actual Port Time Data
The Port Event API provides key actual operational timestamps at ports.
Data Examples:
- ATA (Actual Time of Arrival)
- ATB (Actual Time of Berthing)
- ATD (Actual Time of Departure)
Update Frequency: Every 6 Hours
Why Is It Important?
Traditional ETA predictions can vary greatly depending on:
Weather, Port congestion, Terminal operations, Berth availability
However, the Port Event API is based on actual event times, enabling far more accurate forecasting and analytics.
Use Cases
① Improve Schedule Accuracy for Shipping Lines
By analyzing historical ATA / ATB / ATD patterns, users can identify:
- Average waiting time at Busan Port
- Average berthing time at Singapore Port
- Delay trends by weekday or time zone
This helps improve future ETA calculations and vessel scheduling.
② Supply Chain Visibility for Cargo Owners
Users can determine whether cargo has:
Arrived but waiting offshore, Berthed at terminal, Already departed
-> This supports warehouse planning, inland transport scheduling, and inventory optimization.
③ Government / Research Applications
- Port productivity analysis
- National logistics competitiveness benchmarking
- Bottleneck detection at major ports
- KPI generation for policy making
2. Port Congestion API
Smart Port Performance Indicators Through Quantified Congestion Data
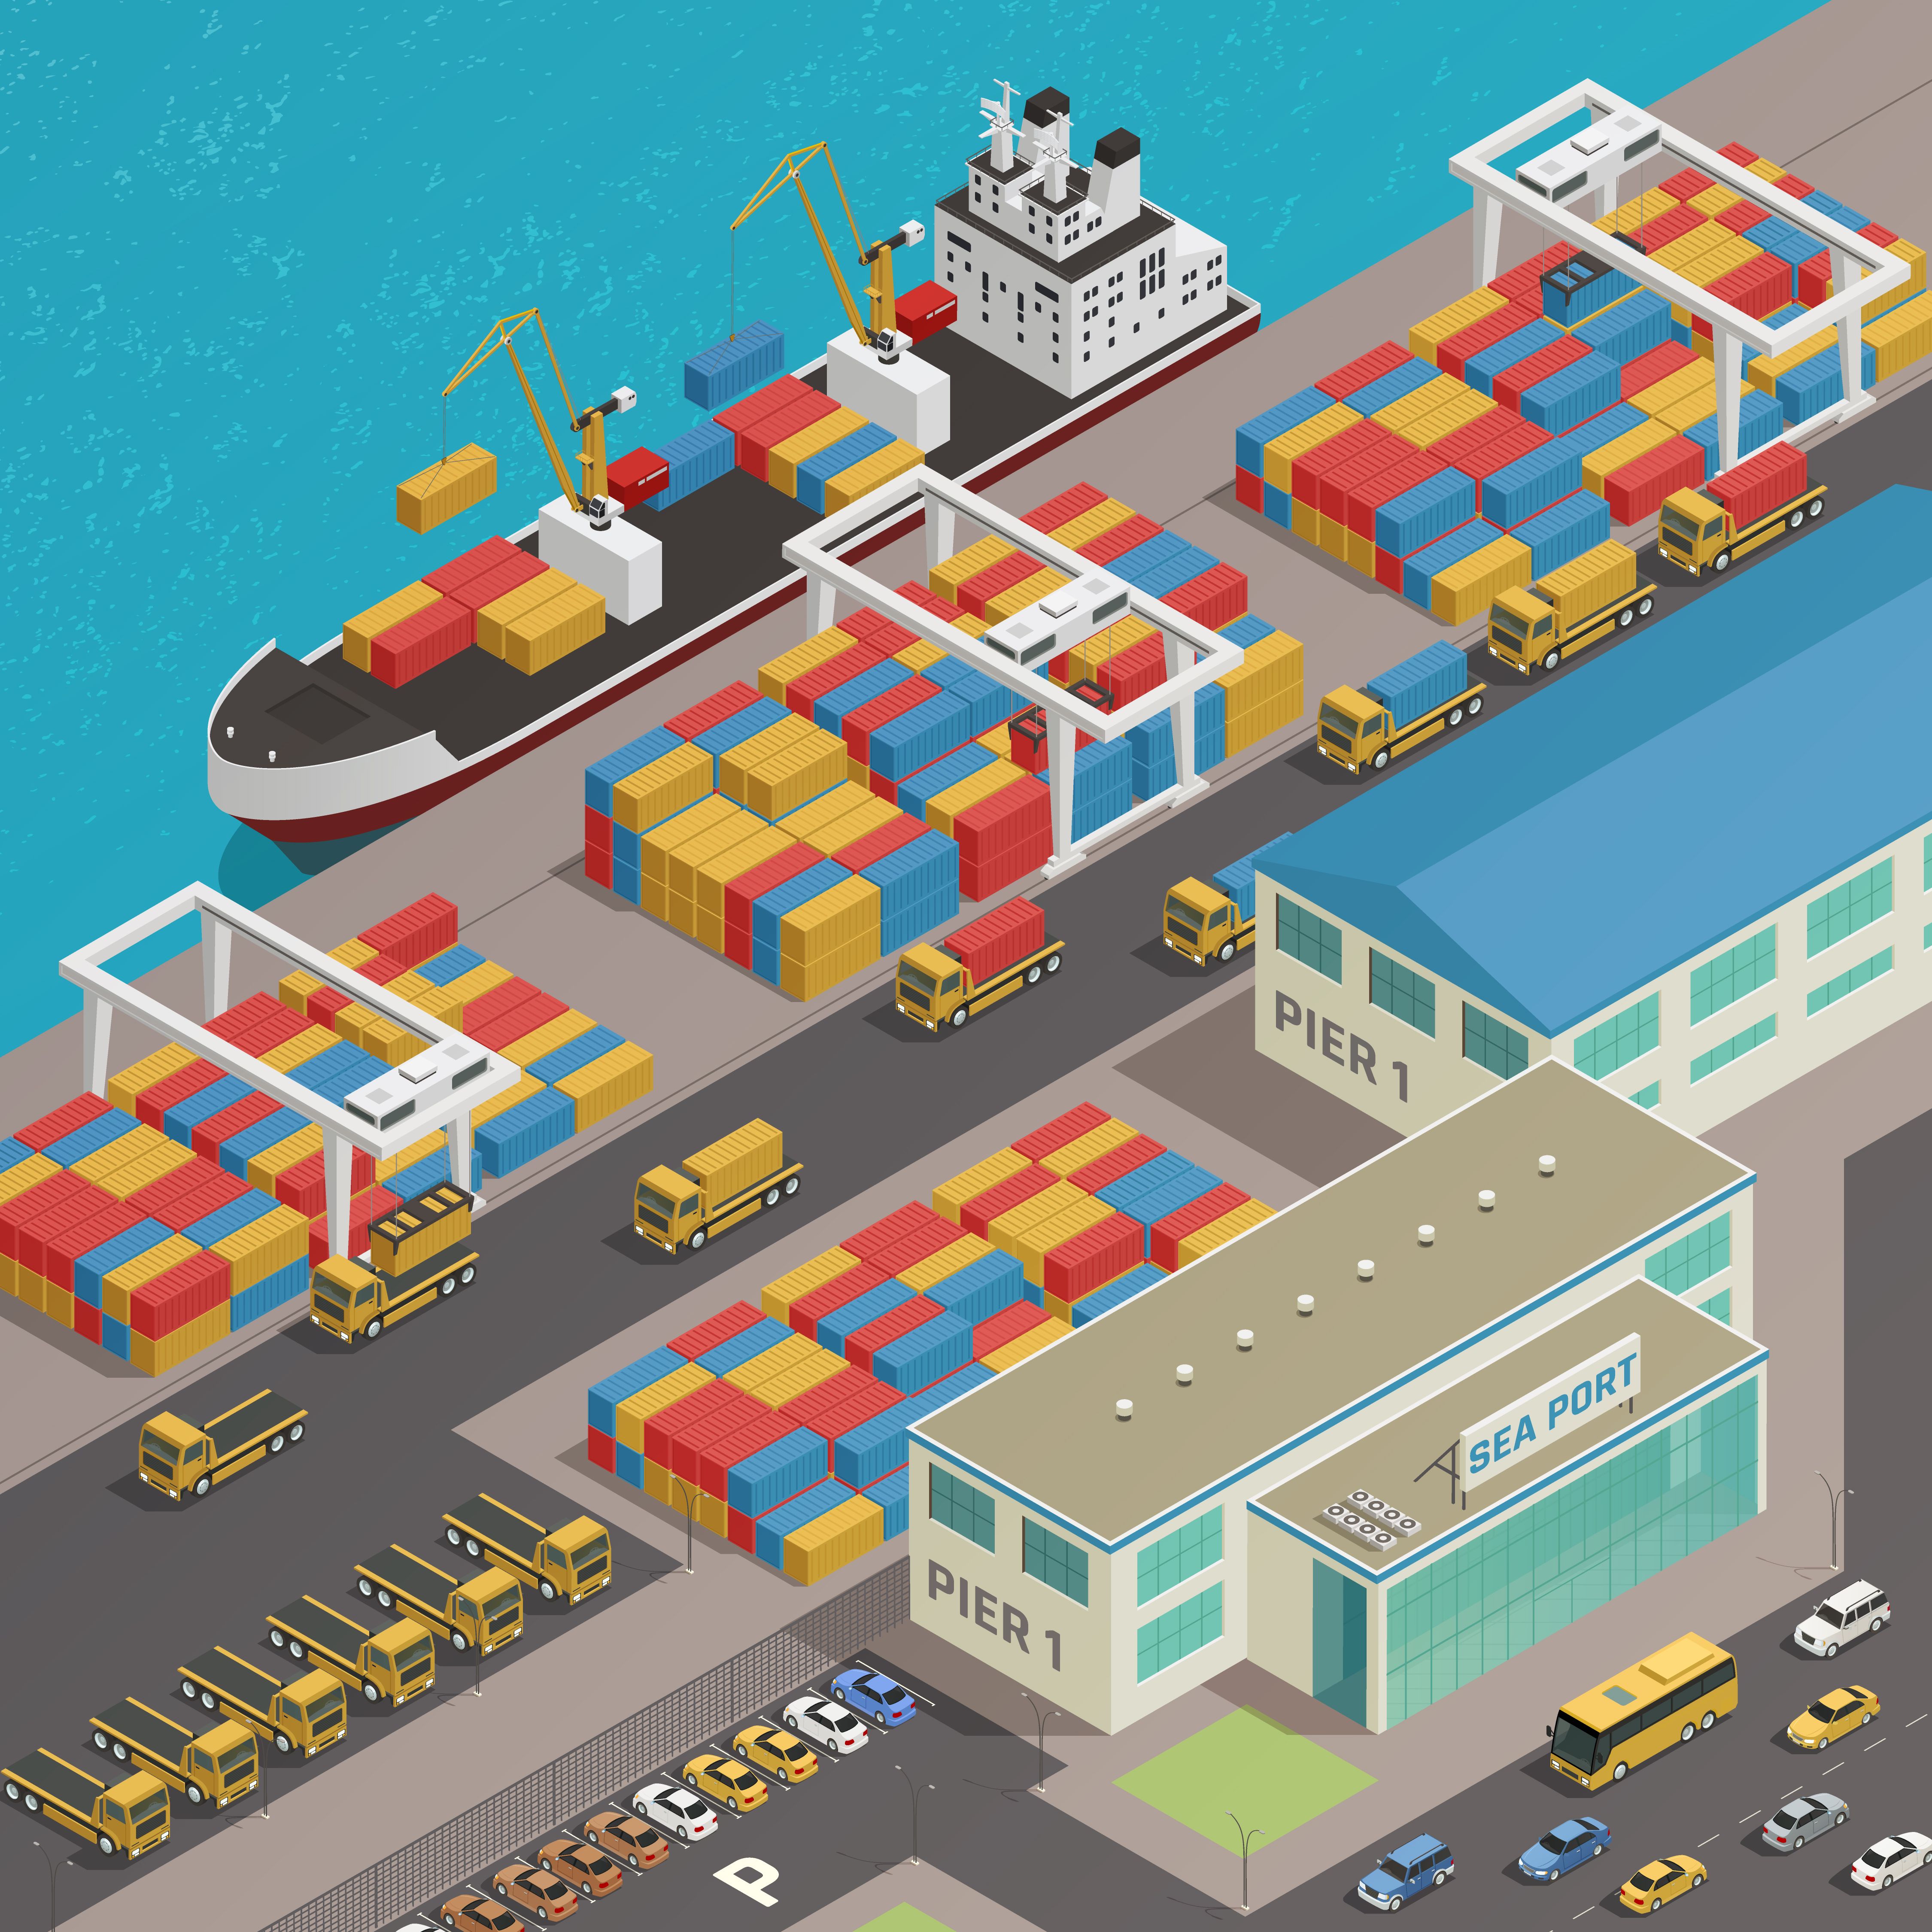
The Port Congestion API provides measurable insights into port traffic and operational efficiency.
Data Examples:
- Waiting Ships
- Berthing Ships
- Waiting Hours
- Vessel Type Classification: Tanker / Bulk / Container / LNG etc.
Update Frequency: Every 6 Hours
Why Is It Important?
Port congestion causes much more than delays:
- Higher voyage operating costs
- Increased fuel consumption
- Cargo delivery delays
- Reduced vessel availability
- Rising freight rates
Use Cases
① Port Call Strategy Optimization
Example:
- Port A waiting time: 48 hours
- Port B waiting time: 12 hours
-> Operators can adjust schedules or reroute vessels.
② Traders / Cargo Owners
Monitor delays in crude oil, grain, LNG, or raw material arrivals to optimize buying and selling timing.
③ Government Agencies
- Compare congestion levels by country
- Prepare import/export logistics response plans
- Monitor disruptions caused by strikes, wars, or severe weather
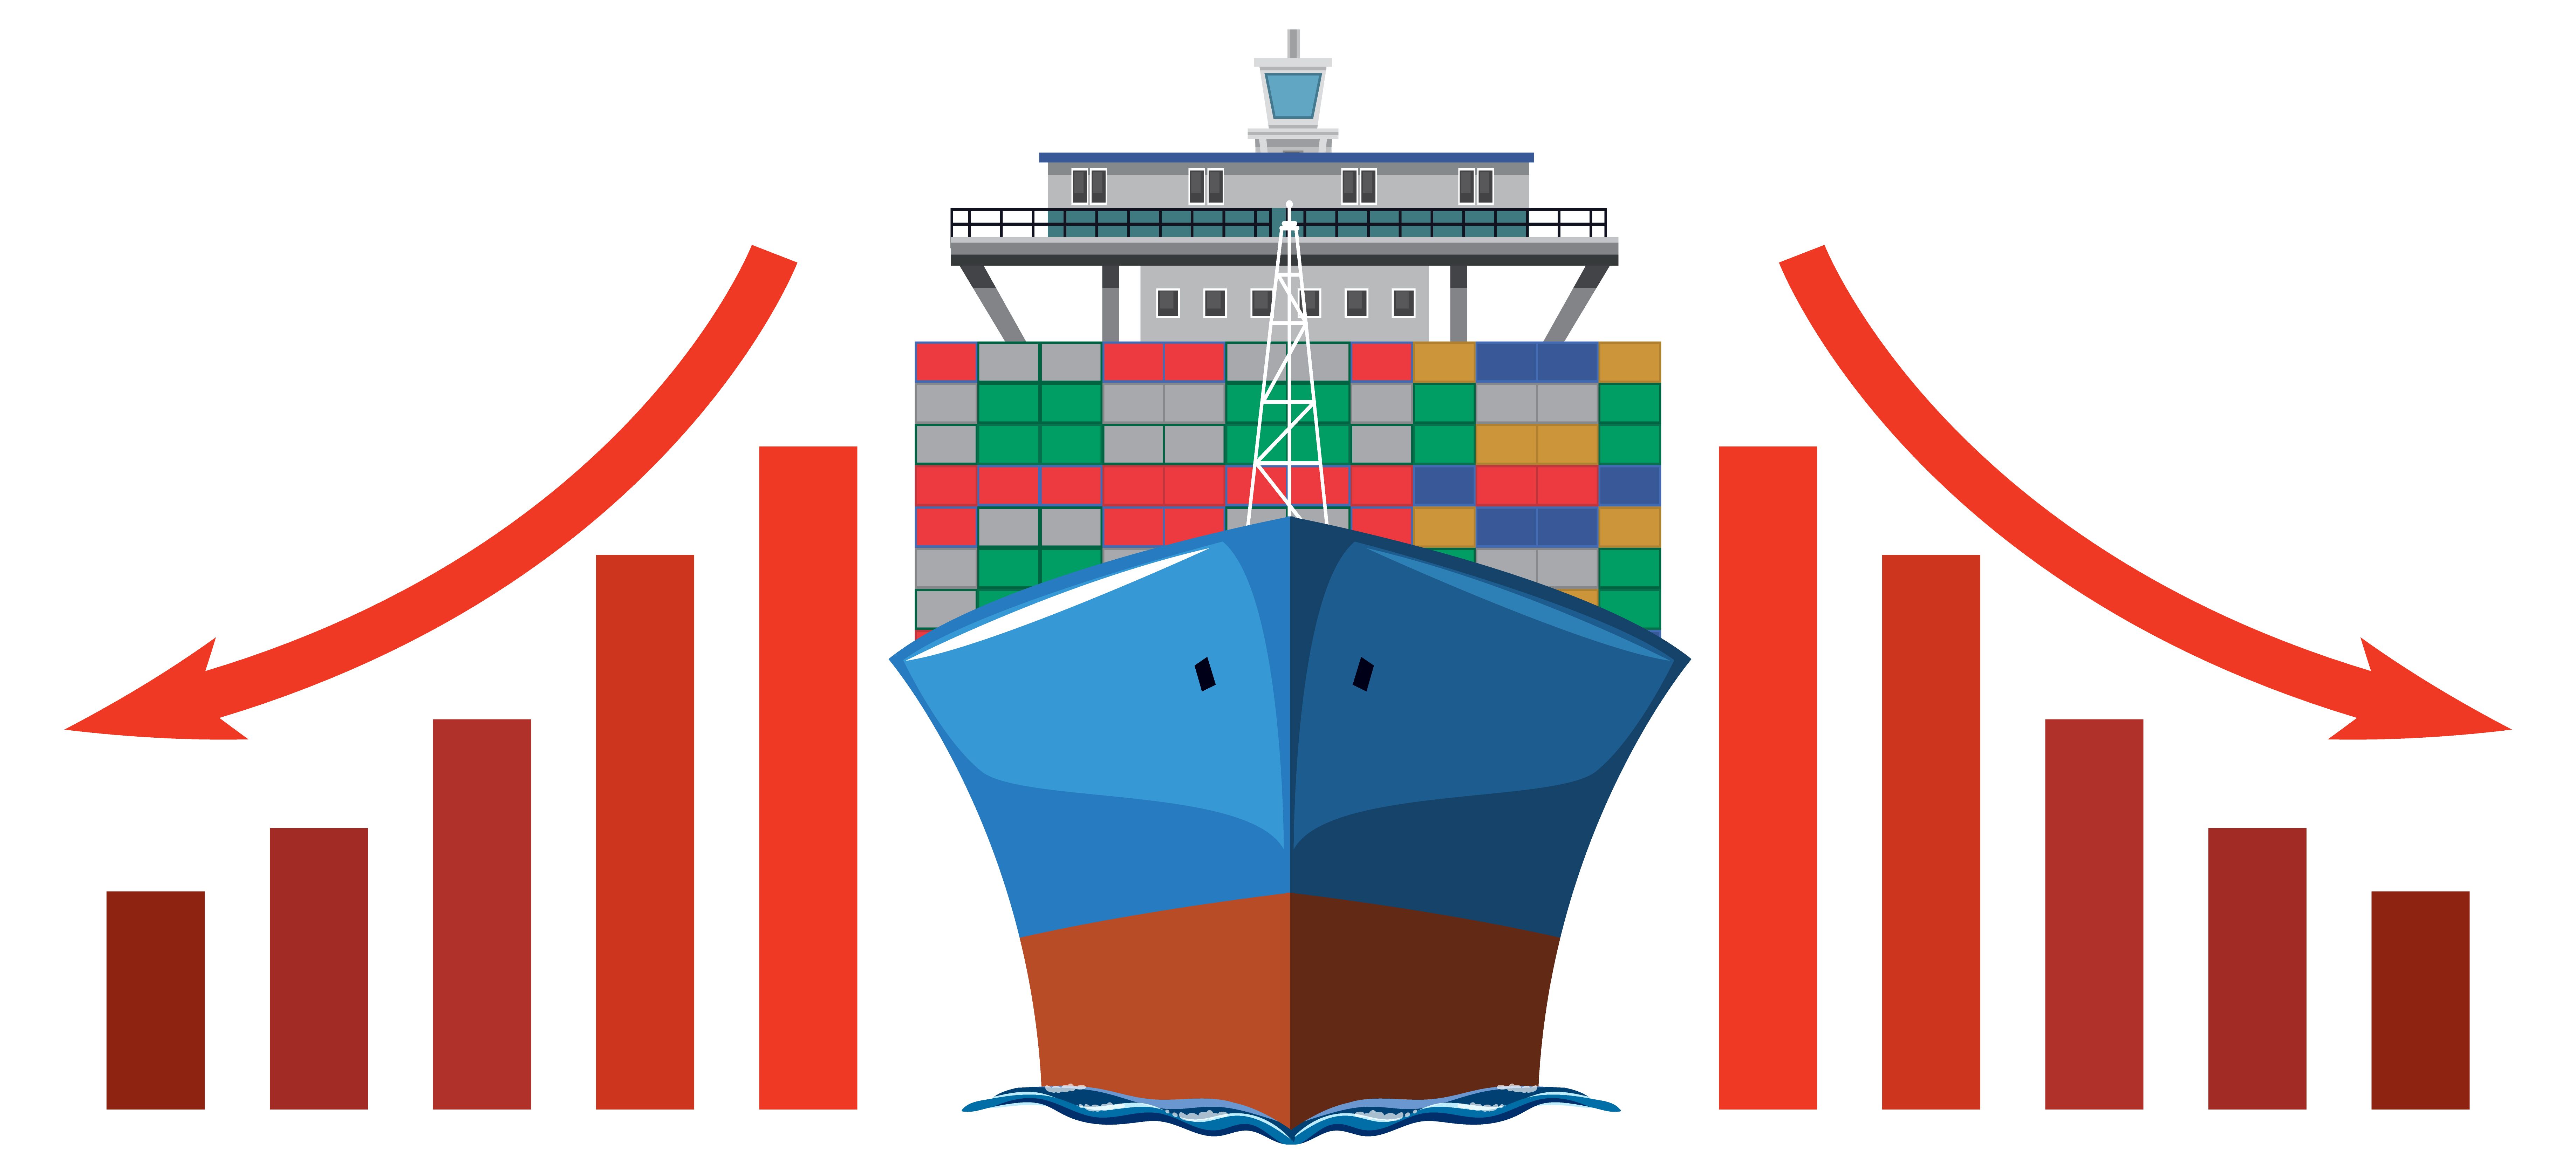
④ Financial / Market Intelligence
Port congestion often acts as a leading economic indicator.
- Rising container vessel queues = possible consumption recovery
- Rising bulk vessel queues = possible raw material demand growth
3. Vessel Event API
Actual Event Monitoring at Individual Vessel Level
The Vessel Event API provides ATA / ATB / ATD events centered on specific vessels rather than ports.
Update Frequency: Every 30 Minutes
What Makes It Different?
- Port Event API = Port-centric view
- Vessel Event API = Vessel-centric view
It focuses on:
“What is Vessel X doing right now?”
instead of:
“What is happening at Port Y?”
Use Cases
① Fleet Management for Shipowners / Operators
For fleets of 100+ vessels, users can instantly identify:
- Which vessels are berthed
- Which vessels have departed
- Which vessels are delayed
② Insurance / Risk Monitoring
Track vessels staying unusually long in high-risk areas or waiting zones.
③ Customer Notification Systems
Example:
“The vessel carrying your cargo has departed.”
Can be automated through API integration.
④ ESG / Carbon Efficiency Analysis
Long idle and waiting periods increase emissions.
-> Users can detect inefficient voyages and optimize operations.
4. Vessel Future Track API
Predicting the Future Route of a Vessel

The Vessel Future Track API provides projected vessel movement.
Data Examples:
- Way Point = Expected route points
- Remained Distance = Remaining sailing distance
Update Frequency: Real-time
What Insights Can It Deliver?
① Enhanced ETA Accuracy
ETA can be refined using
Remaining distance + Current speed (SOG) + Historical average speed
Example:
- Remaining Distance: 480nm
- Current Speed: 12 knots
→ Estimated Arrival: ~40 hours
② Route Deviation Detection
If the actual track differs from predicted waypoints, users can detect:
- Route changes
- Weather avoidance
- Emergency port calls
- Operational risks
③ Port Preparation
Ports can prepare 2–3 days in advance by forecasting inbound routes:
- Tug allocation
- Labor scheduling
- Terminal slot management
④ Maritime Security / Public Sector
- Early monitoring of vessels approaching sensitive waters
- Strait transit prediction
- Suspicious vessel route analysis
Why OceanLook API?
OceanLook is not just a tracking tool.
It is a platform that transforms maritime data into business intelligence.
Today’s shipping industry can no longer rely on intuition alone.
Companies that use data first gain the competitive advantage.
OceanLook’s four value-added APIs combine:
Actual Event Data + Port Congestion Intelligence + Future Route Prediction
to enable smarter maritime decision-making.